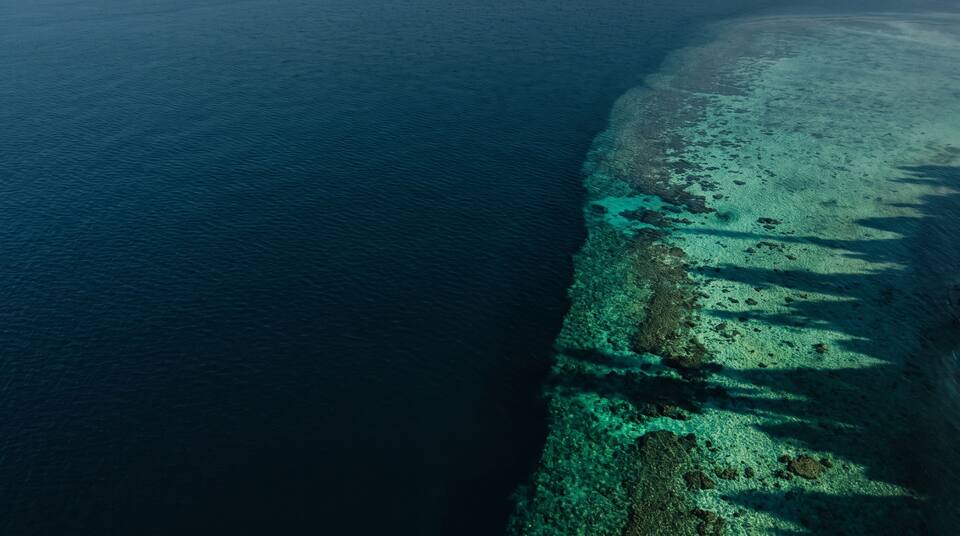
The world ocean,
exposed.
of 0 tracked across 0 of 32 regional seas, each scored 0–10 on documented evidence
The toll
What this run adds up to.
Headline counts from the live feed. Findings are never summed into a single global score; these are counts of records, levels and places.
Severity
Every dot is a finding.
Coloured by level, from Critical (9–10) to Low (0–3). Hollow dots are resolved or stabilized. Click any dot to open its dossier.
Geography
Where the ocean is under strain.
Each regional sea is shaded by its most severe active finding; glowing points are findings with coordinates. Hover for details, click a sea for its page.
Drawing the map…
Grey or untinted means no finding in this feed. It does not mean the sea has no problems. Sea outlines are approximate; findings spanning several seas shade every sea they touch.
What kind of problem
Seventeen ways the ocean is under pressure.
Active findings per category, with the level mix and the top-ranked finding in each. Categories are ranked separately, never against each other.
Issue layer
Four layers of trouble.
Every finding gets exactly one primary layer: a change in the ocean itself, something put into it, something taken from or living in it, or the way it is governed and used.
Ocean basins
Five basins, thirty-two seas.
Active findings per basin; a finding counts once, under its own basin. Under each basin, its regional seas with the number of findings touching them.
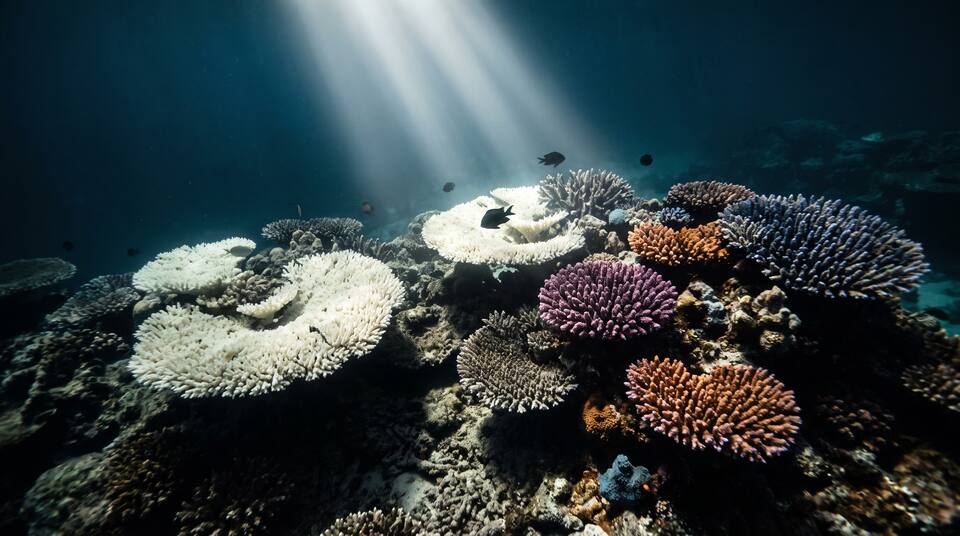
What it harms
Five things every score measures.
Each finding is scored 0–2 on five components, and every point must rest on cited evidence. These are the averages across all active findings, with the rubric wording for the band each average falls in.
Timeline
When the evidence landed.
Findings by the month they were first seen in the feed.
Newest sources
The most recently dated sources cited by any finding.
Where things stand
Fixing it, or still failing?
The current status of every tracked finding, as reported in its most recent source, and the observed direction of every active one.
Status all findings
Trend active findings
The full roll-up
Every finding, one wall.
Every active finding, grouped by regional sea and ranked by score within each. A finding that spans several seas is listed under the first.
How to read this page
- Every figure comes from the live feed and re-renders when a new run is published. Nothing is hand-typed.
- Levels follow the 0–10 score: Critical 9–10, High 7–8, Moderate 4–6, Low 0–3. Rank is within a category only; categories are never ranked against each other.
- Grey seas, empty categories and missing figures mean nothing was found in this feed, not that there is no problem.
Live